Understanding client participation with oversubscribed resources in Flower

I’m running federated learning with Flower where I have more clients configured than my hardware can run concurrently, and I’m not seeing the behavior I expected.

My Setup

  • 8x NVIDIA H100 GPUs

  • 32 federated clients configured (num-supernodes = 32)

  • Each client allocated 0.333 GPU (num-gpus = 0.333)

  • fraction-fit = 1.0 (expecting all clients to participate each round)

  • Using Flower 1.19.0 with Ray backend

What I Expected

With 32 clients configured but only resources for ~20 to run simultaneously, I expected that each round would:

  1. Start 20 clients on available GPUs

  2. Queue the remaining 12 clients

  3. As the first clients finish, the queued ones would get GPU resources and train

  4. The round would complete after all 32 clients had trained

What I’m Observing

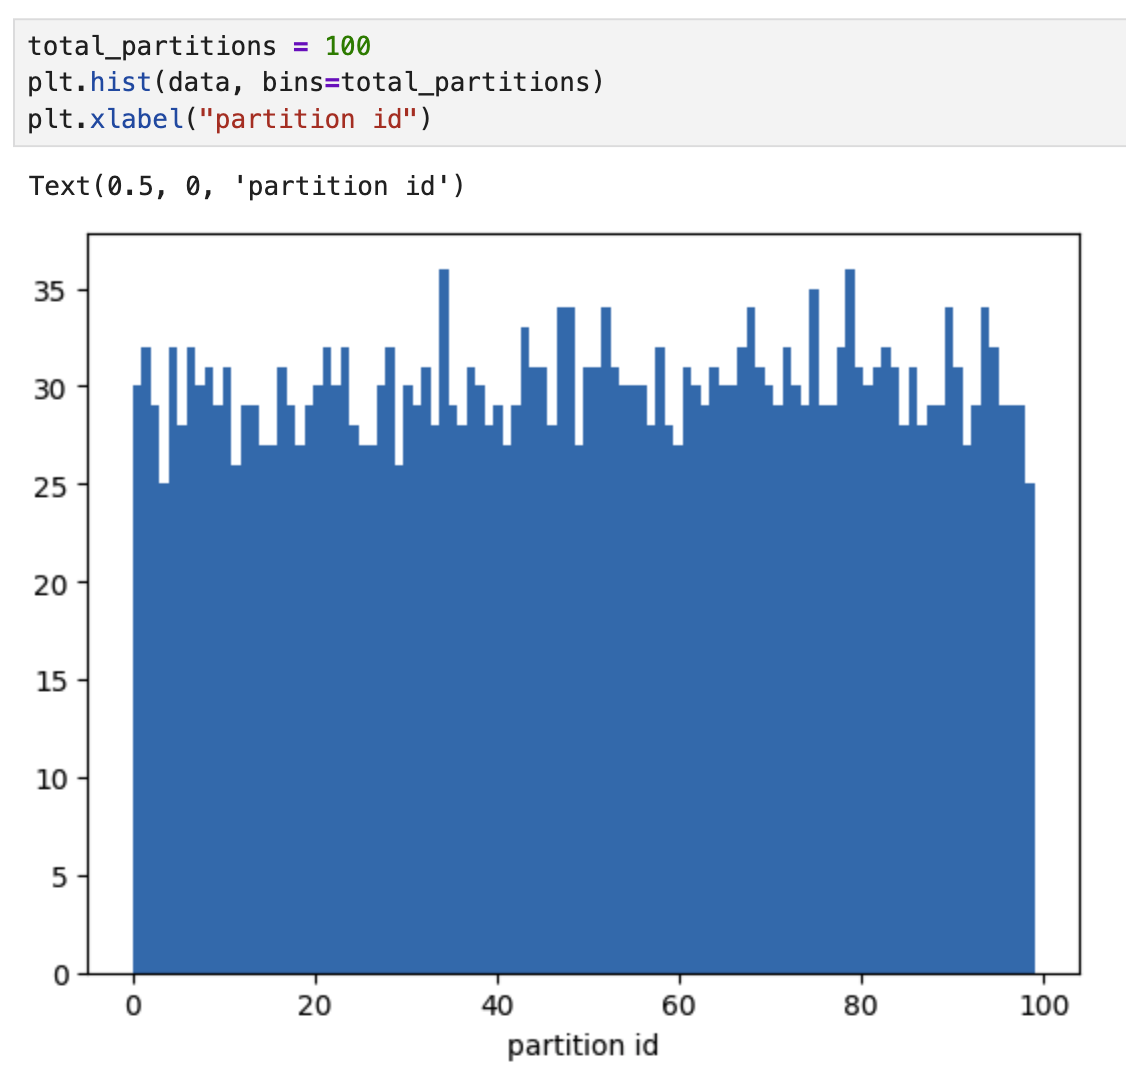
To track which clients actually run, I added logging to client_fn:

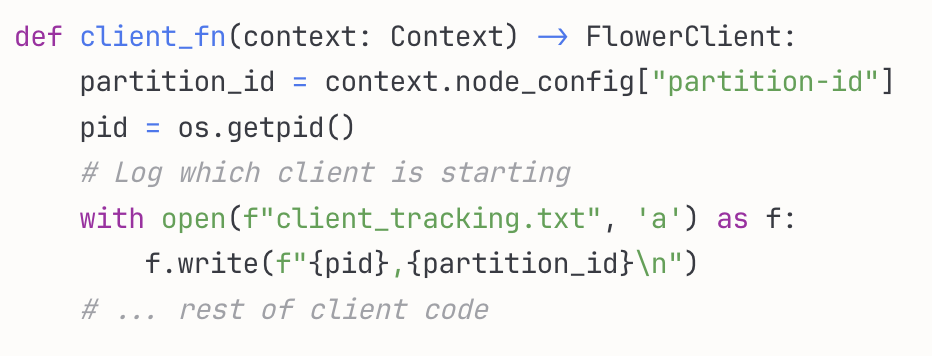
After running 10 rounds:

  • The tracking file shows all 32 clients (partition-id 0-31) register initially

  • GPU monitoring over the entire training period shows only 20 unique client processes ever get GPU resources

  • The same 20 partition IDs run every round

  • The other 12 partition IDs (0,1,2,5,9,12,14,21,22,25,27,28) never execute beyond their initial registration

Even after 10 rounds of training (over 75 minutes), those 12 clients never get scheduled to run. They seem to register at startup but then never actually train.

My Question

Should Flower be scheduling those 12 queued clients to run as GPU resources become available within each round? Or is there something in my configuration preventing the queueing/rotation from working? I expected all 32 clients to take turns training each round (even if it takes longer), but instead the same 20 clients train every round while 12 never run at all.

Thanks for any insights on how client scheduling works when resources are oversubscribed!

1 Like

Hi @griffith ,

The expected behaviour is what you mention: that all those 32 partitions IDs should be present in the client_tracking.txt because indeed all 32 nodes should be scheduled in a round given that you have fraction-fit=1.0.

When oversubscription happen, Flower uses a simple scheduling mechanism based on ray: given that you set fraction_fit=1.0 all 32 virtual clients will be executed but not concurrently (since there are not enough resources). What do you observe if you set num-gpus=0.25 (which should make all your 32 virtual clients run concurrently)?

In the Flower Simulation documentation you’ll find more details about this. And if you check the 7th video in the tutorial series, there i give a visual and informal description of how simulations work.

A simpler test

I ran the quickstart-pytorch example on my 2x 3090 setup using this federation setup in the pyproject.toml :

[tool.flwr.federations.local-simulation-gpu]
options.num-supernodes = 10
options.backend.client-resources.num-cpus = 2
options.backend.client-resources.num-gpus = 0.2

Then launch the run as:

flwr run . local-simulation-gpu

Note the num-gpus=0.2 this will ensure all nodes fit at the same time in my system (10 in total, 5 per GPU). All good. But when I change that setting to num-gpus=0.5, the Simulation Engine will only execute 4 virtual clients/nodes at the same time (two per GPU). However, I’m still able to see all being sampled (since my fraction-fit=1.0). I added the same code snippet as in your screenshot at the top of my client_fn. All looks good.

I also increased num-supernodes=100 to amplify the oversubscription. I was still able to see a near uniform sampling of all nodes (as expected). See below a simply histogram I did w/ matplotlib:

! Note part of the noise here is due to fraction-evaluate=0.5 which only involves half of the nodes in a round of evaluate but these are also recorded in the .txt tracking partitions-ids. If we set fraction-evaluat=1.0 then the histogram observed would be perfectly flat (100% uniform)

:right_arrow: Could you try the the quickstart-pytorch example as well and let me know if you observe the issue ?

One possibility to why you only observe 20 supernodes is that you aren’t setting the number of supernodes correctly? or maybe not in the federation you are actually executing?

PS: it was great reading your post. Super well structured, perfect level of detail :100: